Carmignac P. Emergents - February 2023 Update
Portfolio News
Performance - F EUR ACC shareclass - Cumulative returns (%)
| February 2023 | 2022 | 3 years | 5 years | |
| Carmignac P. Emergents | -4,6% | -14,4% | +18,5% | +18,5% |
| Performance reference indicator | -4,2% | -14,9% | +6,6% | +4,7% |
* MSCI EM NR (USD) dividends net dividend reinvested
China - including Hong Kong. Excluding derivative positions Carmignac's portfolios are subject to change at any time. Data are rebased to 100% for Sector & Country positioning. Source: Carmignac, 28/02/2023
Market Review
Emerging market equities dropped in February as US 10-year real yields soared.
All sectors were hit hard but Internet and e-commerce in particular, along with cyclical sectors due to the stronger dollar and rise in long term yields, which dragged some commodity prices down.
Chinese markets fell the sharpest, mainly due to the resurgence of geopolitical tension with the United States, which weighed on market sentiment. Economic indicators showed a gentle recovery in the consumer and services sectors. Earnings announcements didn’t inspire much enthusiasm but did suggest an encouraging upward trend.
Mexico continued to outperform after publishing some brighter economic data, while the other Latin American and Middle Eastern countries were affected by the appreciation of the dollar and weakness of commodity prices.
Performance Review
-
TOP 3 CONTRIBUTORS
Good resistance of some Chinese & Mexican stocks
MINISO (Cons. Disc.) - China
GRUPO BANORTE (Finance) - Mexico
LENOVO (Tech) - China
-
TOP 3 DETRACTORS
Weakness of Chinese and Korean consumer and tech names
ALIBABA (Cons. Disc.) - China
ELETROBRAS (Clean Energy ) - Brazil
JD.COM (Cons. Disc. ) - China
Notable portfolio moves
New positions:
Reinforcements: Didi Global (China), Taiwan Semiconductor (Taiwan), Banorte (Mexico)
Reductions: ISA CTEEP (Brazil), Hapvida (Brazil)
Positions sold:
Number of holdings: 37 (target range 35/55)
Positioning

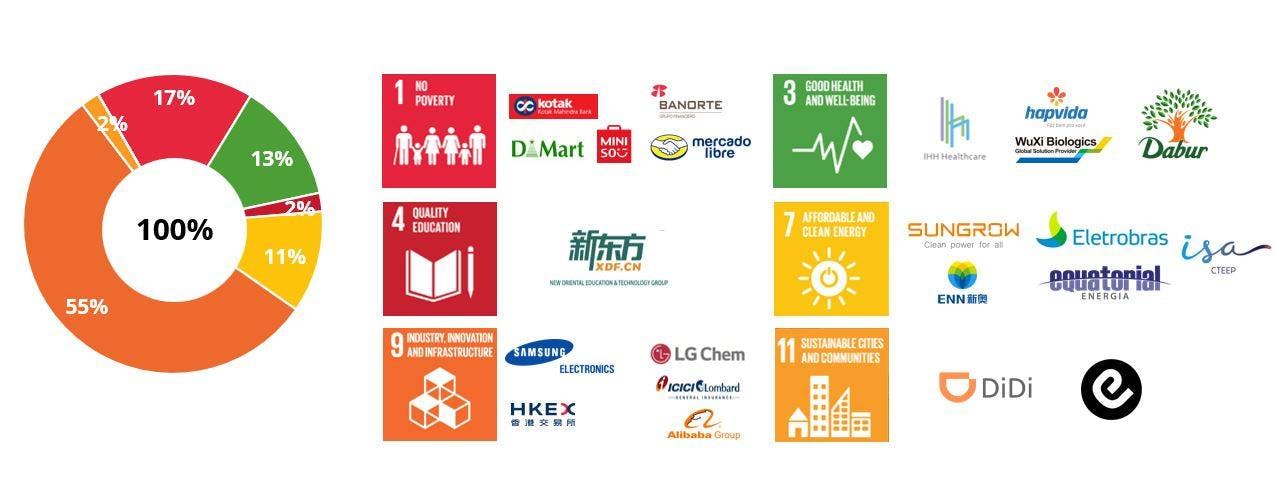
Breakdown of the fund by SDG alignment
Our portfolio is currently structured around 4 major socially responsible investment (SRI) themes that are central to our process:

Strategy reminder
Carmignac Portfolio Emergents A EUR Acc
Recommended minimum investment horizon
Lower risk Higher risk
EQUITY: The Fund may be affected by stock price variations, the scale of which is dependent on external factors, stock trading volumes or market capitalization.
EMERGING MARKETS: Operating conditions and supervision in "emerging" markets may deviate from the standards prevailing on the large international exchanges and have an impact on prices of listed instruments in which the Fund may invest.
CURRENCY: Currency risk is linked to exposure to a currency other than the Fund’s valuation currency, either through direct investment or the use of forward financial instruments.
DISCRETIONARY MANAGEMENT: Anticipations of financial market changes made by the Management Company have a direct effect on the Fund's performance, which depends on the stocks selected.
The Fund presents a risk of loss of capital.
Carmignac Portfolio Emergents A EUR Acc
| 2014 | 2015 | 2016 | 2017 | 2018 | 2019 | 2020 | 2021 | 2022 | 2023 |
2024 (YTD) ? Year to date |
|
|---|---|---|---|---|---|---|---|---|---|---|---|
| Carmignac Portfolio Emergents A EUR Acc | - | -4.12 % | +1.08 % | +18.94 % | -18.75 % | +24.90 % | +43.84 % | -10.95 % | -14.80 % | +9.22 % | +5.29 % |
| Reference Indicator | - | -5.99 % | +14.51 % | +20.59 % | -10.27 % | +20.61 % | +8.54 % | +4.86 % | -14.85 % | +6.11 % | +10.79 % |
Scroll right to see full table
| 3 Years | 5 Years | 10 Years | |
|---|---|---|---|
| Carmignac Portfolio Emergents A EUR Acc | -6.11 % | +6.92 % | - |
| Reference Indicator | -1.81 % | +4.35 % | - |
Scroll right to see full table
Source: Carmignac at 28/06/2024
| Entry costs : | 4,00% of the amount you pay in when entering this investment. This is the most you will be charged. Carmignac Gestion doesn't charge any entry fee. The person selling you the product will inform you of the actual charge. |
| Exit costs : | We do not charge an exit fee for this product. |
| Management fees and other administrative or operating costs : | 1,97% of the value of your investment per year. This estimate is based on actual costs over the past year. |
| Performance fees : | 20,00% when the share class overperforms the Reference indicator during the performance period. It will be payable also in case the share class has overperformed the reference indicator but had a negative performance. Underperformance is clawed back for 5 years. The actual amount will vary depending on how well your investment performs. The aggregated cost estimation above includes the average over the last 5 years, or since the product creation if it is less than 5 years. |
| Transaction Cost : | 0,37% of the value of your investment per year. This is an estimate of the costs incurred when we buy and sell the investments underlying the product. The actual amount varies depending on the quantity we buy and sell. |